
The Dashboard is the first item you will see when you login successfully. Below you will find details about the menu and the items.
Dashboard gives you an overview of some key business statistics, including; Cash Flow, Operating Margin, Current Ratio, Expense, and Profit and Loss. Click here for more information about the Dashboard.
Transaction – The sidebar allows you to access different modules of myBooks. You can raise estimates, invoices, etc. from the Sales module; Record expenses, bills, etc. from the Purchases module.
Contacts – myBooks allows you to keep a list of your business contacts within the program and contact can be customer, vendor, or both. myBooks allows you to create contact who can be the customer and a vendor.
Items – – Here you can create a new item that adds to the catalog of products you sell to your customers.
Banking – Here you can reconcile your bank statements by connecting to your bank account or import your bank statements.
Documents –This is the tab where all the documents uploaded in transactions can be viewed and also user can also upload other documents.
Business – Allows you to manage/switch between multiple myBooks businesses.
Settings – Here you can access the settings section, where you can configure and customize myBooks to your preference.
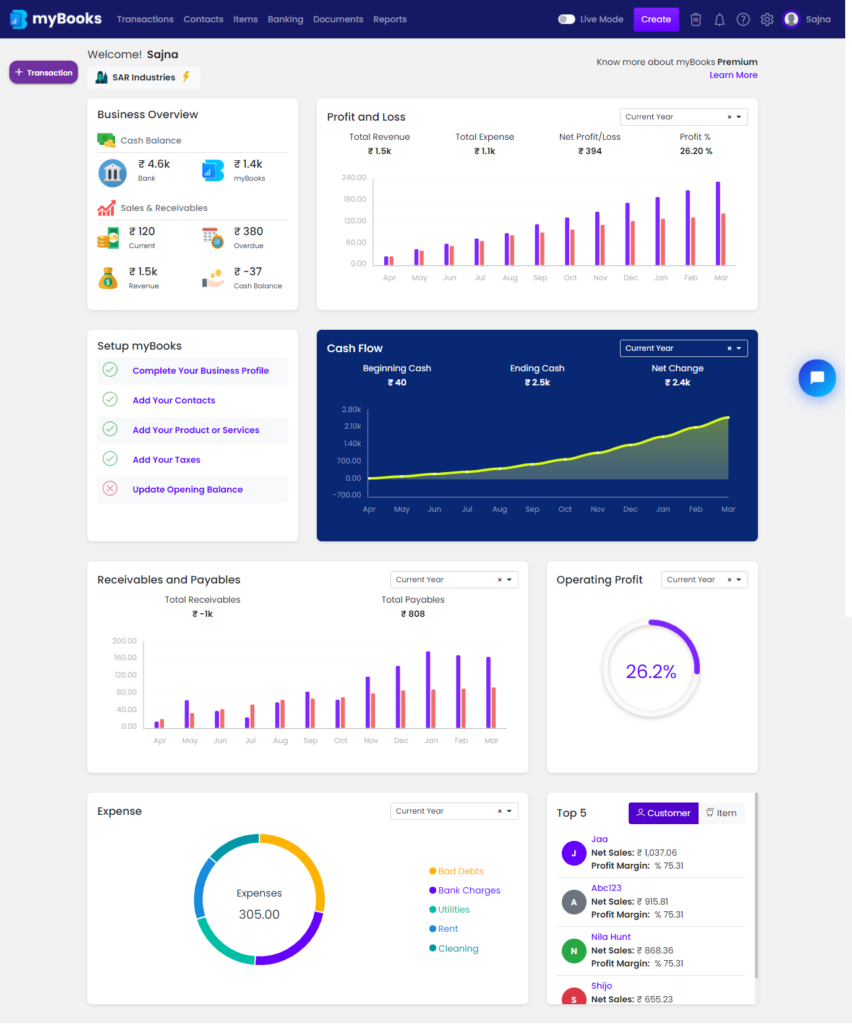
The Dashboard has following sections:
Overview
In Bank
This chart displays the total amount from your bank feeds provided that myBooks is connected to your bank account and also when the bank statement is imported. This chart will display the total amount from and bank feeds and bank statements imported in myBooks.
In myBooks
This chart will show the total amount of reconciliation done in myBooks banking. This chart will be helpful in finding out the balance between Bank and myBooks.
Current
This chart displays the amount of unpaid customer invoices and unused credit memos by date, so every day the current chart will display the updated amount. This chart will be helpful in identifying the amount of unused invoices and credit notes.
Overdue
This chart displays the amount of overdue customer invoices and overdue credit memos by date, so every day the current chart will display the updated amount. This chart will be helpful in identifying the amount of unused invoices and credit notes.
Revenue
This chart displays the total amount of invoices created so far in myBooks. So every time invoice the revenue chart in the dashboard will display the updated amount. This chart is helpful in identifying the revenue you have earned so far.
Cash Balance
This chart displays the current cash balance you have in myBooks. Whenever a payment made to bills or a payment received for the invoice. myBooks will automatically calculate and will display the correct amount based on the transactions entered in myBooks.
Set Up myBooks
Business profile – This will prompt you to complete the business profile. When clicked on it will redirect to the business profile.
Contacts – When click on add your contacts it will redirect to create a contact page and Once the contacts have added to the myBooks. It will as marked as completed in setup myBooks.
Opening balance – Update the opening balance and when clicked on it will redirect to the opening balance.
Items – Here you can create a new item that adds to the catalog of products you sell to your customers.
Taxes – Setting up taxes and it will redirect to tax page.
Data Migration – Import your data from your old accounting software and it will take you to the mass migration page.
Mobile App – Download the myBooks into your cell phone. MyBooks app is available both in IOS and Android.
Cash Flow – Cash flow is the money that is flowing in and out of your business in the form of payments for expenses, like rent or a mortgage, in monthly loan payments, and in payments for taxes and other accounts payable. These graphs are generated based on the cash flow report of your business.
Receivables and Payables – This chart will be helpful in identifying the total receivables and total payables for the current year in myBooks. When clicked on chart it will redirect to invoice and bill report
Operating Profit – Operating margin displays the company’s revenues after paying all the company expenses. It can be calculated by dividing a company’s operating income (also known as “operating profit“) during a given period by its net sales.
Expense – This section displays your top expenses across different categories in the form of a pie chart. These pie charts are generated based on the Expense by Category report of your business. This a simple and effective visual aid to help you track where your money is going.
Top 5 – This section displays your top 5 customers in terms of net sales and profit margin and it also displays the top 5 items in terms of net sales and profit margin.