
The Dashboard is the first screen you will see when you login successfully. Below you will find details about the menu and the items seen above.

Dashboard – Gives you over cash flow, plan variances, expense and profit & loss.Click here for more information about the Dashboard.
PlanData – This screen allows access plan data in myplan and in plan data transaction can be created.
Reports – Clicking the reports field it will redirect to various types of reports which can be generated in myplan.
Master Data Maintenance – Here this screen allows to access time and version. By default time and version will be created in myplan.
Live mode – Allows the users to switch between demo account and live account.
Settings – Here you can access the settings section, where you can configure and customize myPlan to your preference.
The Dashboard has following charts.
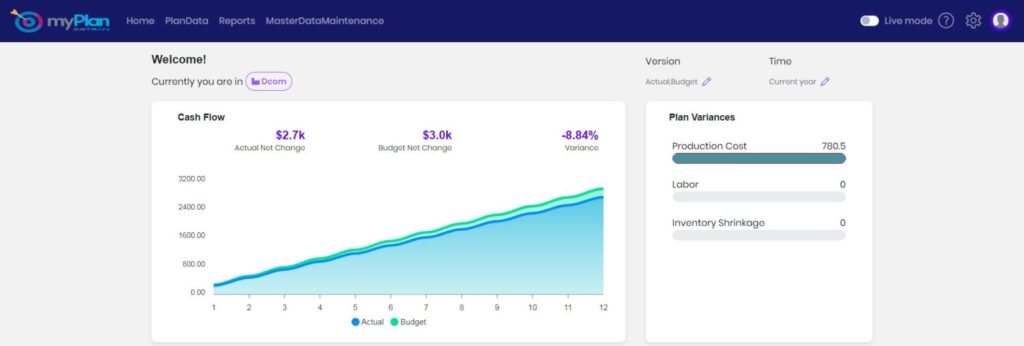
Cash flow – This chart displays the cash balance from actual and budget in myPlan. Whenever a cash plandata is created in myPlan it will be displayed in the cash flow chart. Cash amount for actual and budget will be displayed and also the variance will be displayed by calculating from actual and budget.
Plan variances – This chart displays your top plan from different types of plans created in myplan. This chart will display top 5 plans created in myplan and the data will be displayed in bar charts. This chart will help you keep track of top 5 variances in myplan.
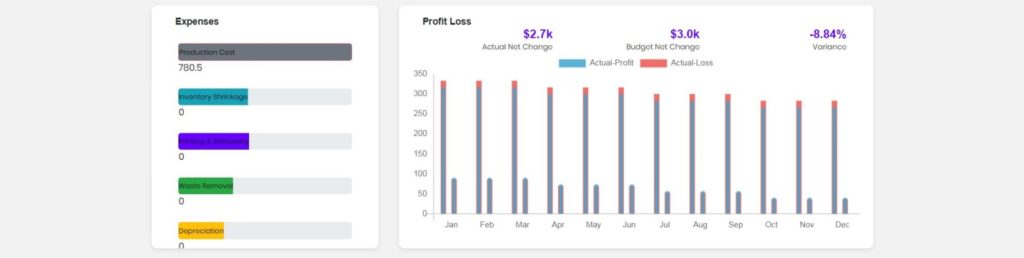
Expense – This section displays your top expenses across different categories in the form of a bar chart. These bar charts are generated based on the Expense created in myPlan. This is a simple and effective visual aid to help you track where your money is going.
Profit & Loss – Profit & loss report will be generated based on the data created in myPlan. Now plan data can be created under budget or actual. Plan data created under these categorizes will be calculated and displayed in bar charts. Actual will have different bar chart and budget will have different bar chart.